Prof. Dr. Markus Meier
Leibniz Institute for Baltic Sea Research Warnemünde (IOW)
E-Mail: markus.meier@io-warnemuende.de
Large-scale atmosphere and ocean circulations#
Basics
Atmospheric circulation
Oceanic circulation
Basics#
in previous lecture we investigated radiation balance of the Earth with incoming solar radiation and outgoing thermal radiation. we know that insolation is way stronger at the equator than at higher latitudes, also outgoing radiation not constant over latitude:
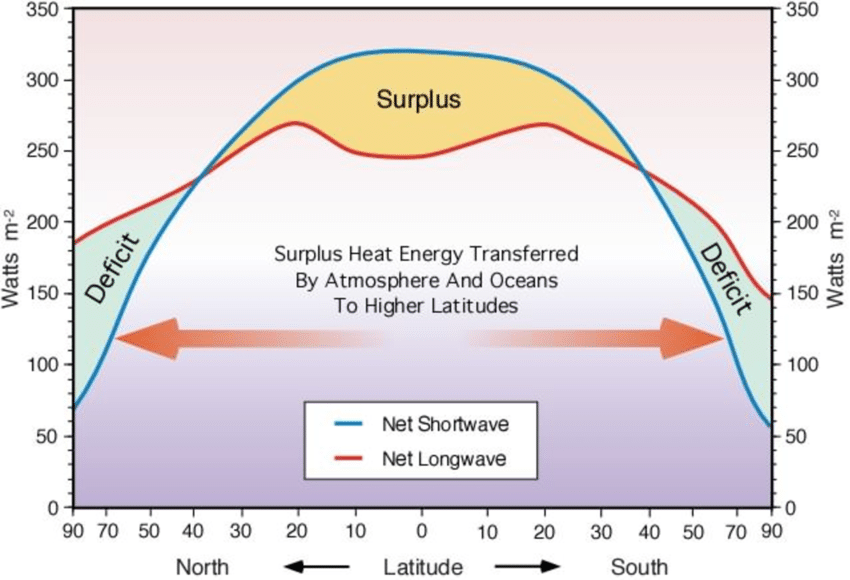
can resolve this as map plot over latitude and longitude to get a full spatial picture of the absorbed and emitted radiation

net energy gain at low ad energy loss at high latitudes. this imbalance leads energy transport in form of heat from the equator to the poles in the atmosphere and the ocean. these two mediums have very different characteristics:
compressibility: water is incompressible liquid (density doesn’t depend much on pressure) and air is an ideal gas that is very well compressible (pV=nkT)
density: water is 1000 times denser than air, atmospheric density only temperature dependent, ocean density temperature and salinity dependent
heat capacity: water has 4 times larger heat capacity than air
forcing: Oceans are forced from the top, atmosphere from below. this has implications for mixing; also ocean currents are mostly forced by atmospheric winds, atmospheric winds are initiated by temperature contrast
spatiality: atmoshpere has no boundaries while the oceans have lateral boundaries with small gateways between the 3 major basins (e.g. Indonesia through flow, Drake passage)
latent heating: (=energy transferred in a process without change of the body’s temperature, for example, in a phase change), not happening in oceans, atmospheric circulation is driven by latent heating by water phase transitions (e.g. liquid to water vapour and vice versa) to some part
salinity: affects density profile of the oceans. no salt in atmosphere
sea ice: oceans have floating sea ice affecting air-sea exchange of heat, water vapour and momentum
weather systems tranpsort energy via heat and momentum, atmospheric weather systems have to be way larger than oceanic ones to store similar amount of energy:
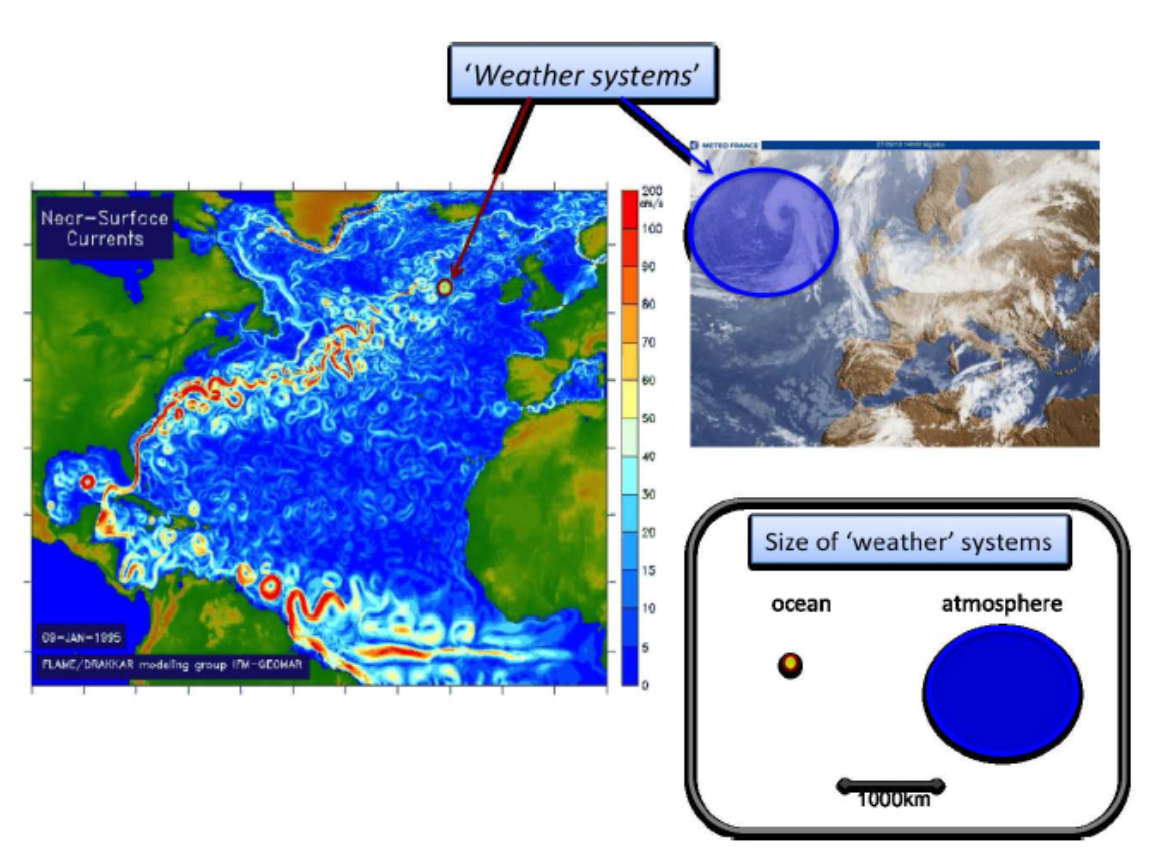
talk a bit about gulf stream
Atmospheric circulation#
live global surface winds: https://earth.nullschool.net
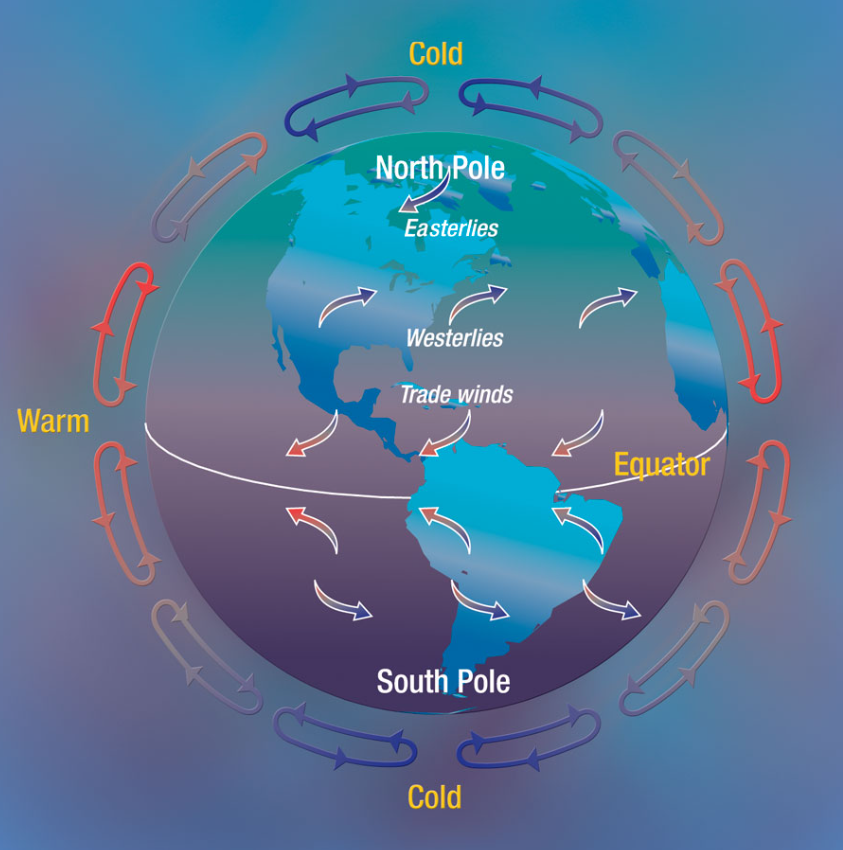
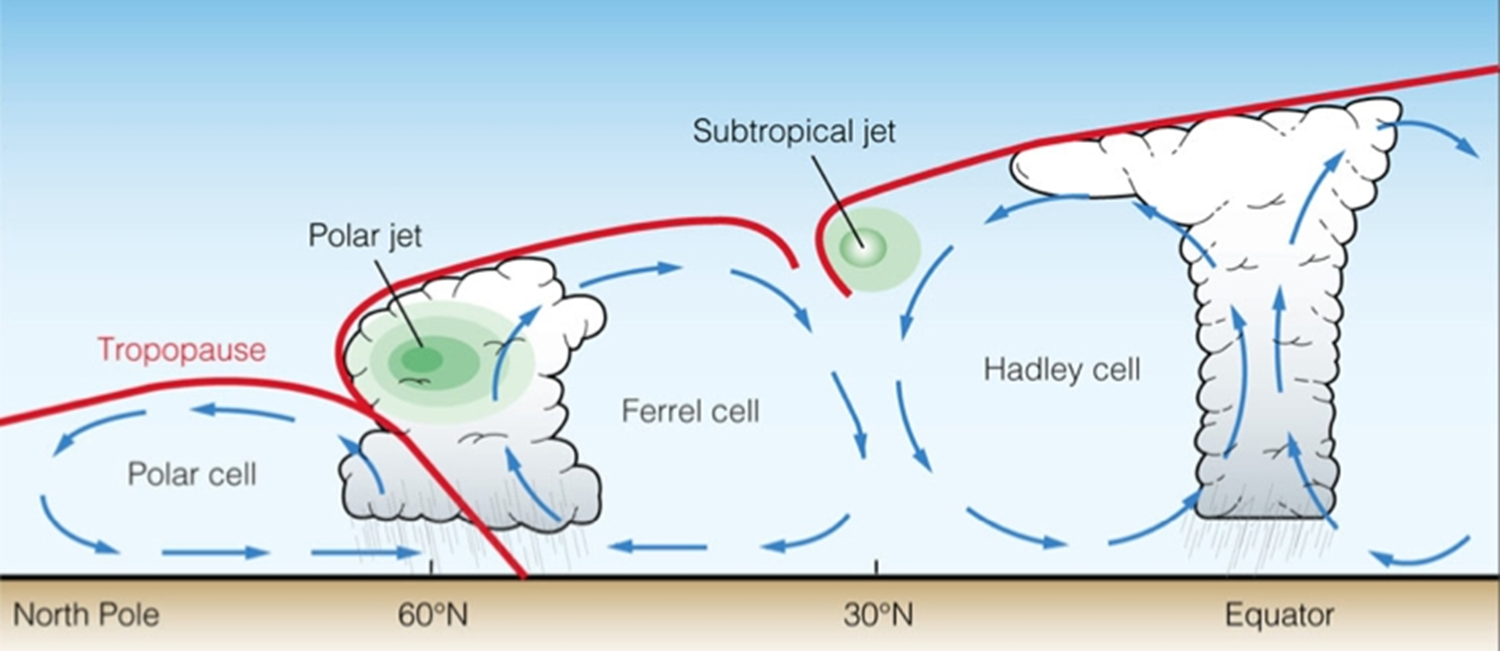
Hadley cell subtropic, very north polar cell, in between ferrel-cell (only exists in some kind of mean to communicate between the other two); these cells characterize northern and southern atmosphere
Air rising at equator, then to 30°N at the height, then falling down and so on
Coriolis force deflects transported particles due to earths rotation and causes passat-winds, which explain earth’s wind bands which are important because they force the oceans
Diversion and conversion at 30°/60°N
Jets are amplified: winds have to increase with height (thermal wind) -> come back later
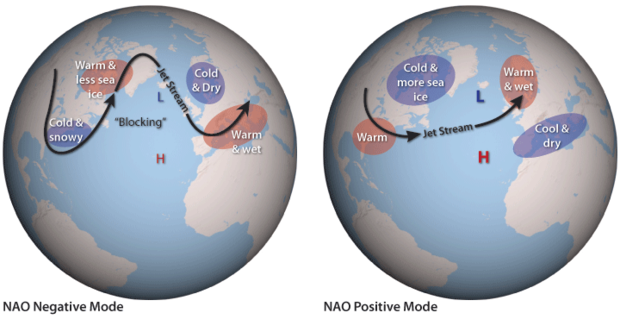
In atmosphere we have cells and different patterns of variability described by quasistationary high or low pressure systems, ie Nao very relevant for northern europe weather in winter
NAO: quasistationary pressure systems Icelandic Low and Azores High, explains a lot of the variane in Northern European weather in winter.
Ocean circulation#
General#
2/3 of world’s surface is oceans. ocean has charcteristic temperature profile. most of it is very cold and only close to the surface it gets warmer, especially for lower latitudes.
Thermocline in tropics not in higher latitudes, very deep ocean below 1000-3000km is rather homogenous with only small gradient.
Characteristic of ocean not only temperature but also salinity -> densitiy depends on them
Salinity higher due to evaporation in some latitudes but also dependent on freshwater supply (rivers, ice melting)
But temperature main driver of density

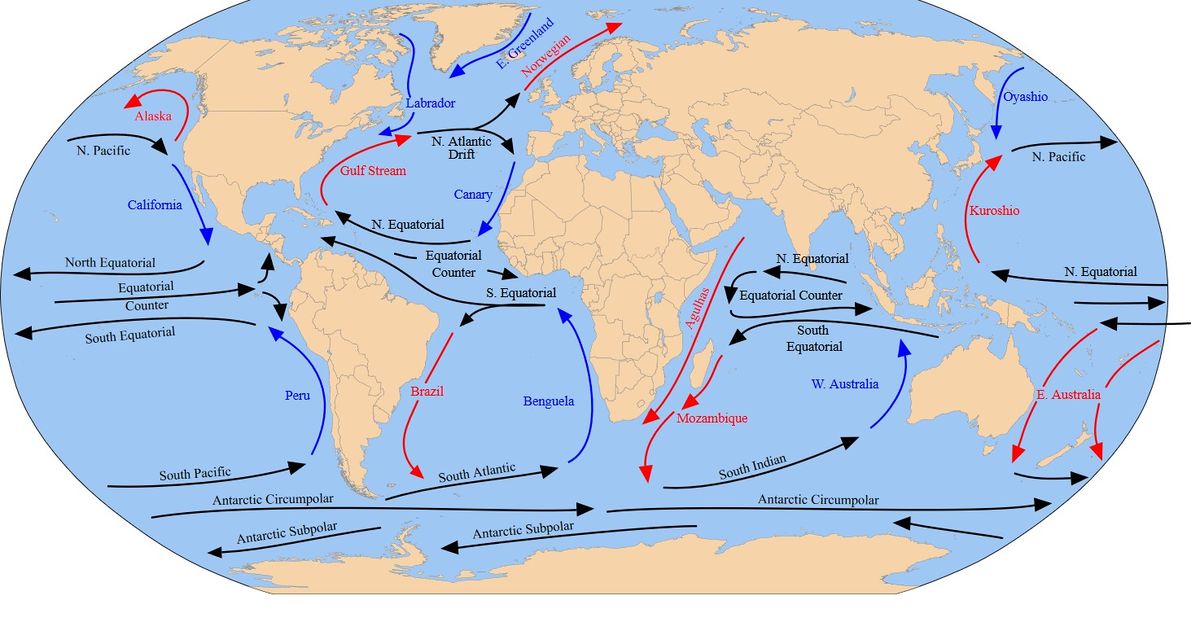
Wind driven surface circulation: clock/anticlockwise depending on hemisphere -> corioslis force deflects to right in North and to left in South
Gyers are natural consequences of momentum equations (can/will calculate/show later). Gyers are in each basins
Global conveyor belt#
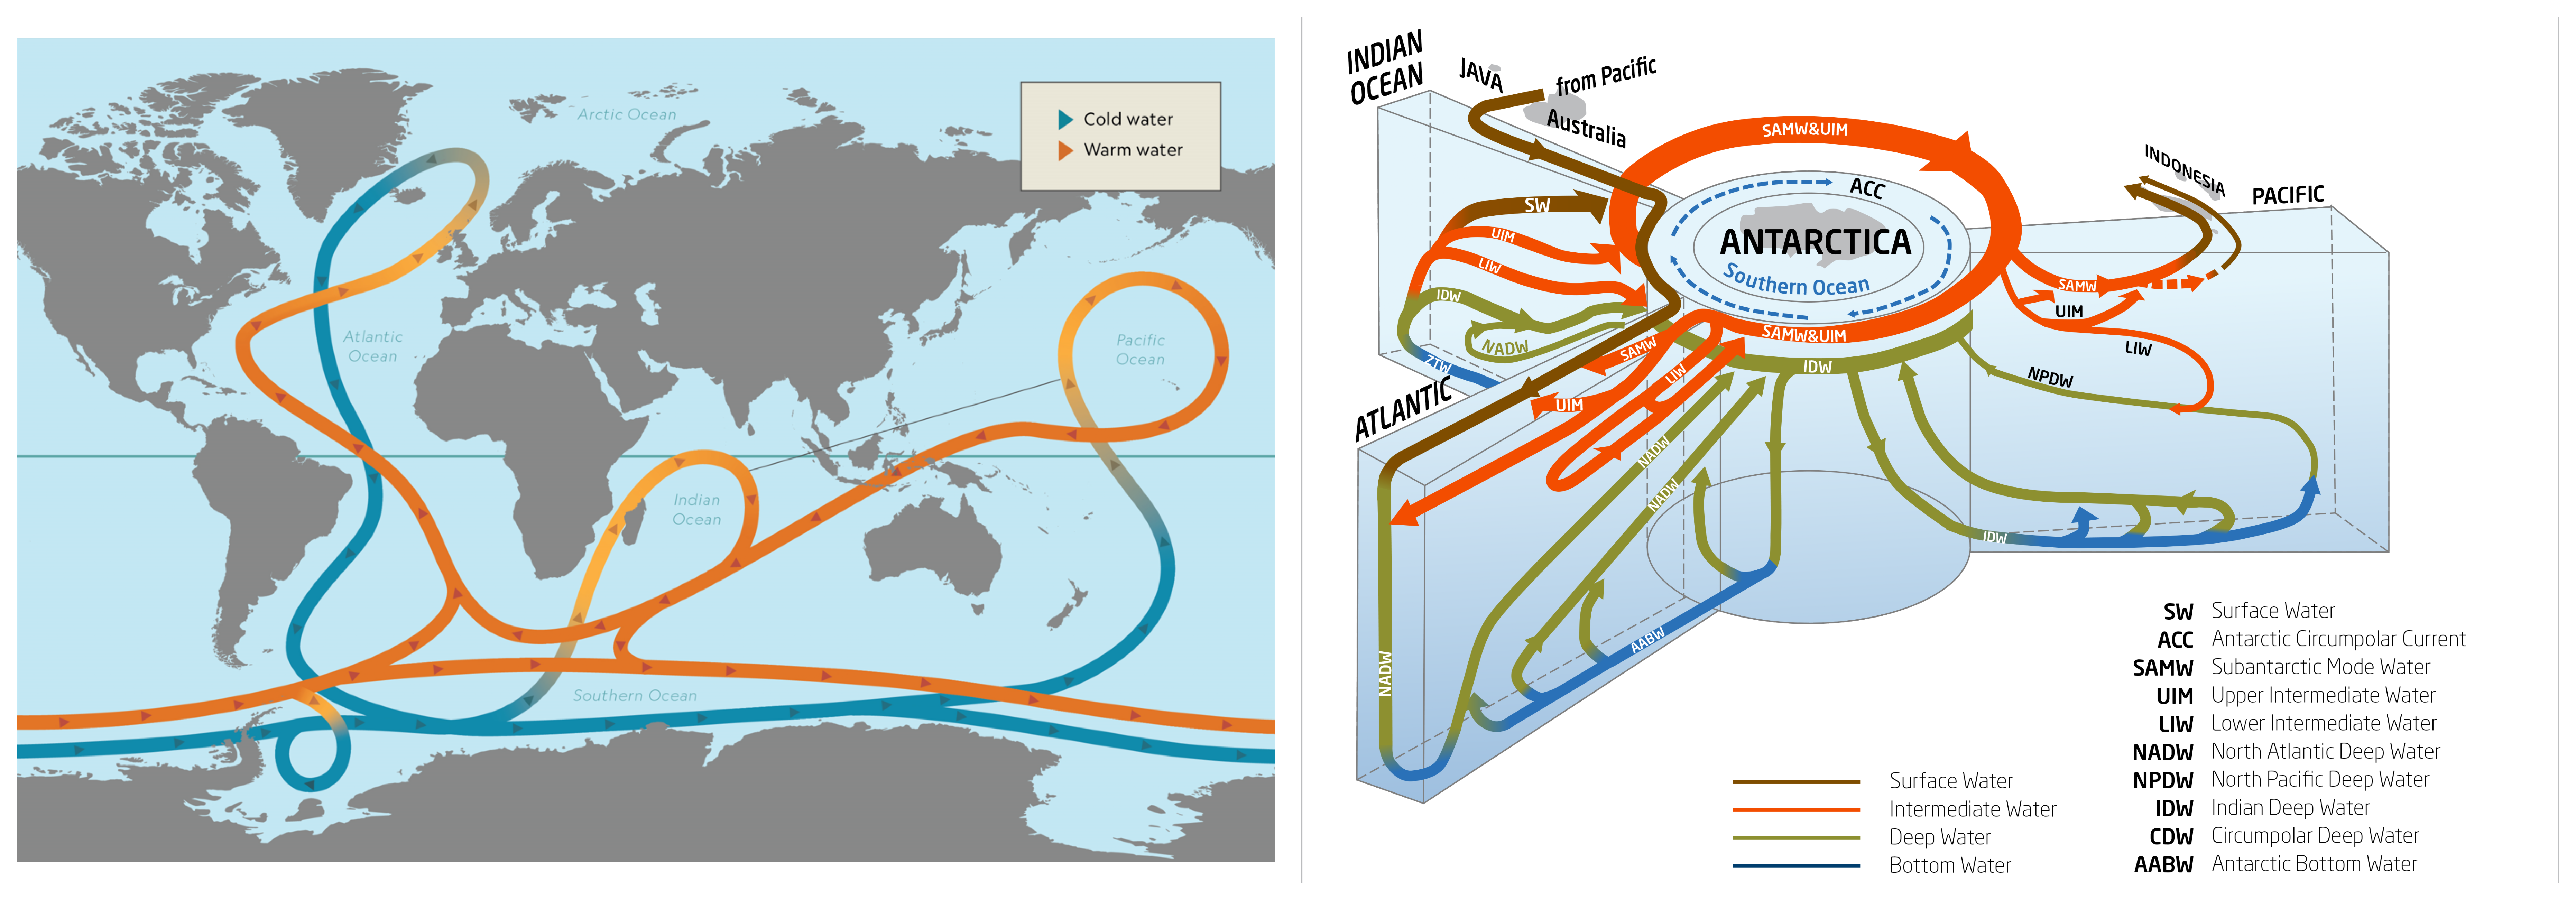
idealized global oceanic currents, system of currents that transports water around the world.
Deep water formation#
sinking of water masses, that only takes place in a few areas around the oceans. associated with vertical mixing via convection
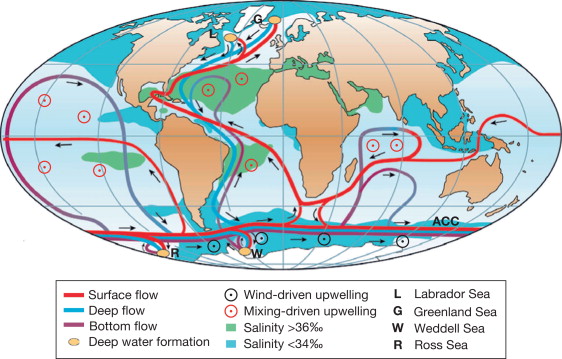
AMOC: -Nadw north atlantic deep water heavy but even heavier aabw antarctic bottom water, we can distinguish even more water masses, figur is idolized, Cold water can take up more nutrients and co2 in dissolved forms -> different to warmer water in tropical regions
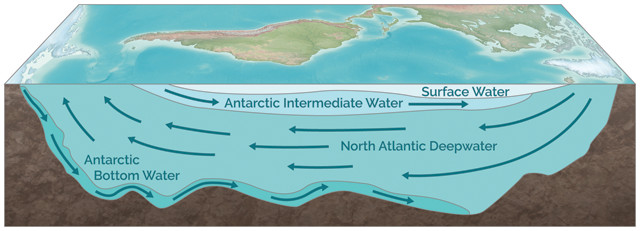
different meridional circulation directions in Atlantic and Pacific Ocean. in Atlantic warm surface water flowing northward transporting energy and after it gives away its heat is falls down to form North Atalntic deepwater. in Pacific circulation the other way around, cold deep water rising in Northern latitudes, absorbing heat from the atmosphere and flow back at the top. why?
find the two circulations in global conveyor belt, Figure 10, is in accordance
this has tremendous effect on surrounding land masses ie antarctica, is reason for different climates in northern europe/america at same latitudes (no deep water formation in pacific)

U- cubash: antartic sea ice from the left: wind (cold) breaks up pieces of sea ice (polynya) which gives space for heat flux from ocean thereby a lot of heat extraction from the ocean. Also ocean is touched by cold atmospheric air so there is more sea ice formation (ice salinty ca 4g/kg). much less salt in ice than in ocean -> rejected salt is sinking down and results in heaviest water you can form, falls down into antarctic bottom water
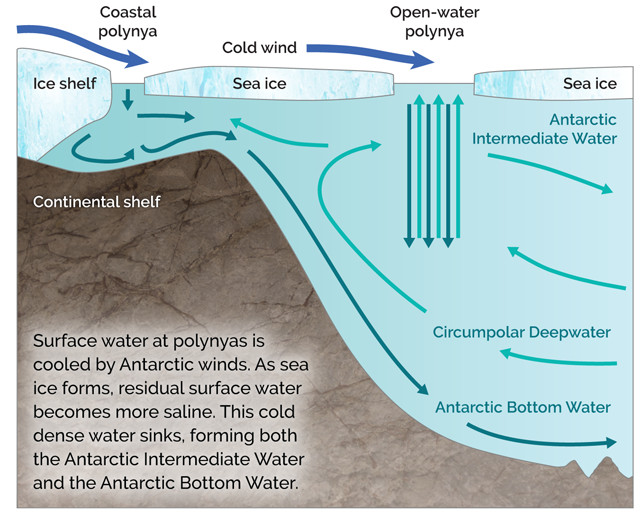
summarizing the places where deep-water formation is happening, only very few (see Figure 14): Greenland Sea, Labrador Sea, Weddell Sea, Ross Sea
main causes of deep water formation: buoyancy, cooling, sea ice formation
Coastal up- and downwelling#
wind can suck water from the deep or push it down: wind blowing parallel to the coast forces surface water in the same direction. due to coriolis force this movement gets deflected to the right on the N. H. and left on the S. H. - this process is also called Ekamn transport. now water is incompressible and due to continuity if surface water gets pushed away from coast water from deeper down has to rise at the coast: upwelling. if surface water gets pushed to the coast it has to sink down due to continuity, no other place to go: downwelling.
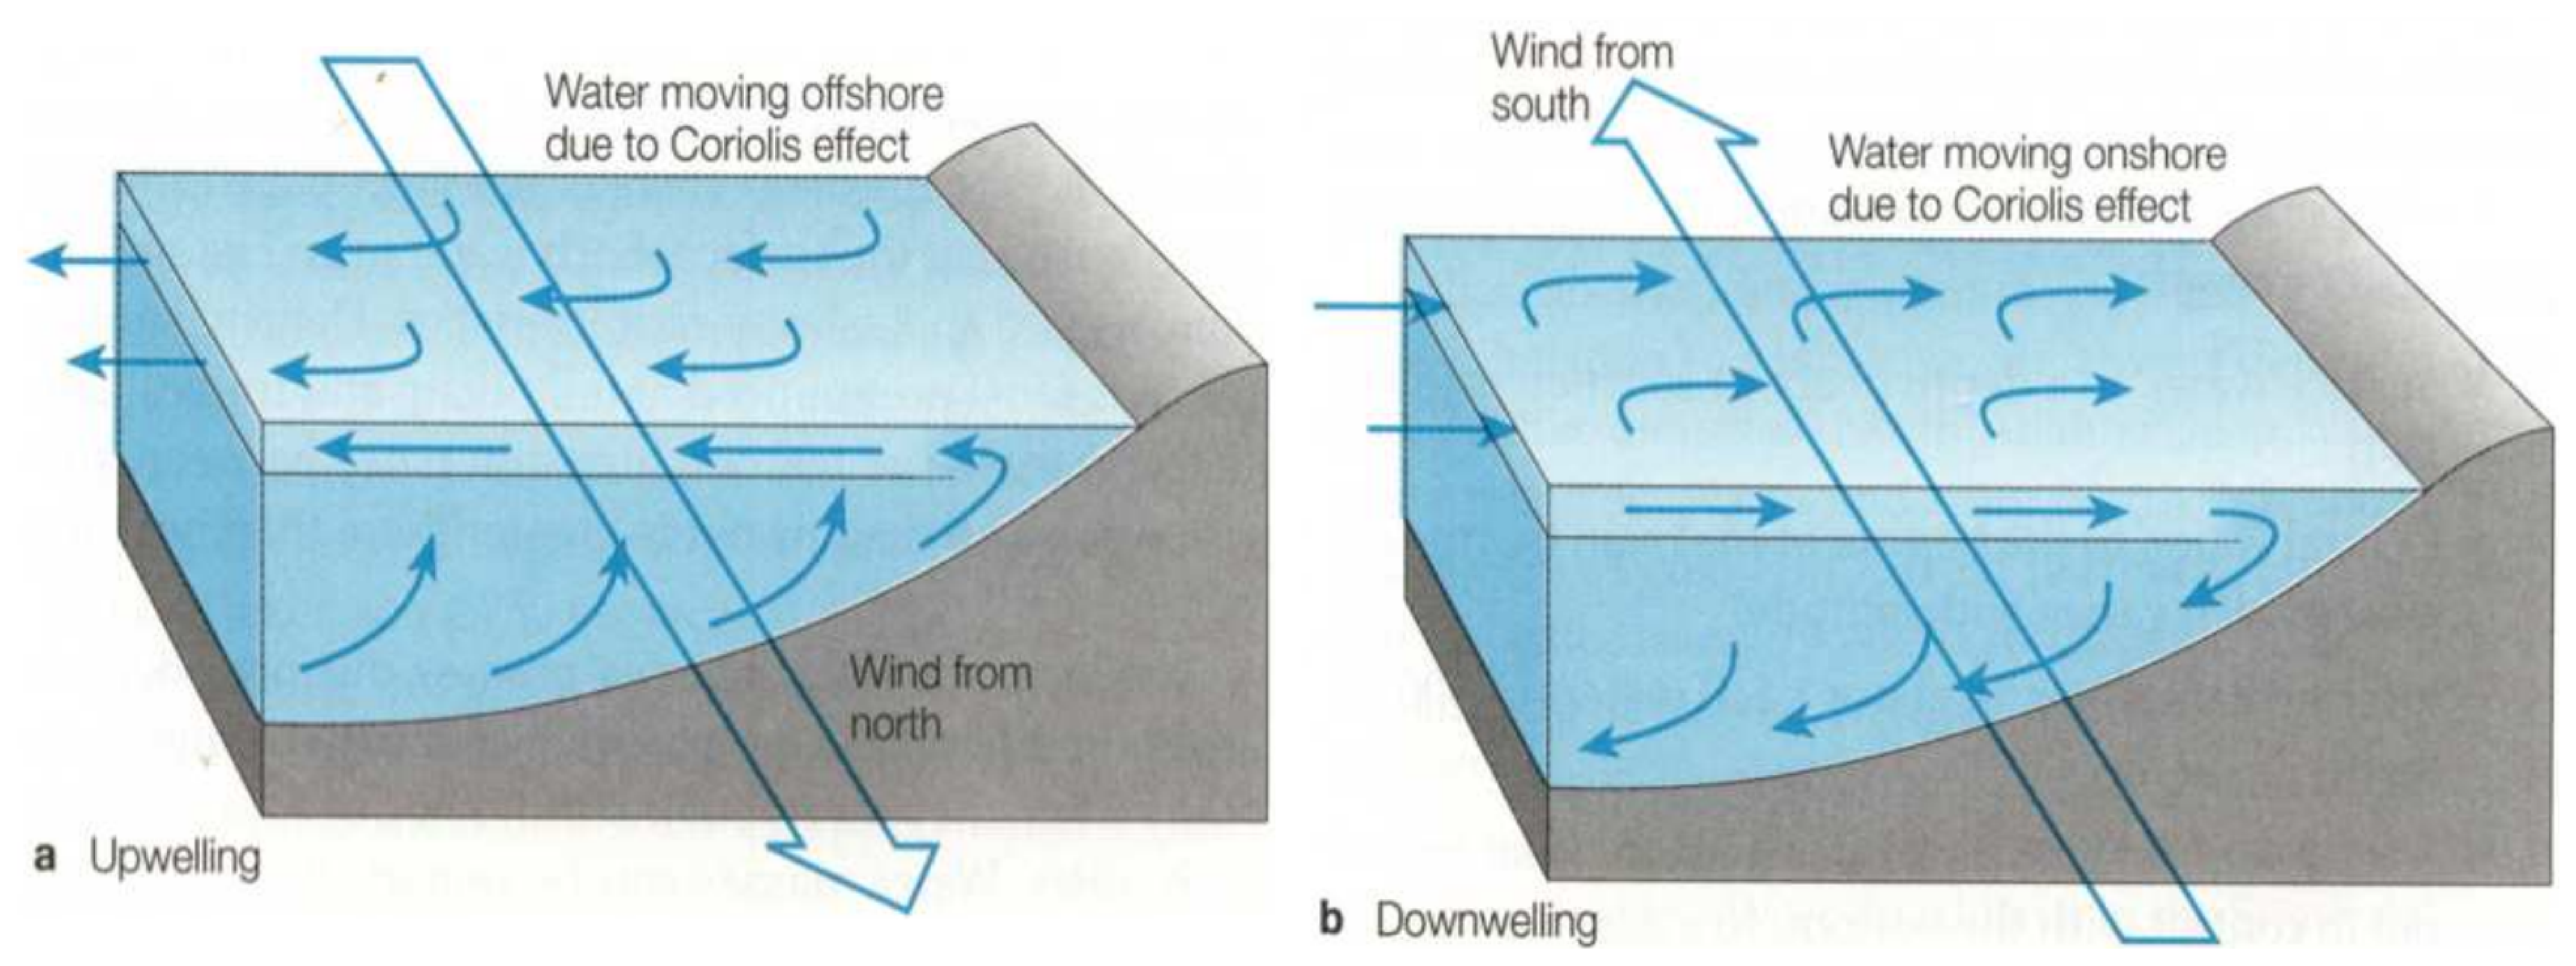
depending on coastal geography and direction of the wind. some coasts are prone for up- or downwelling. figure 16 shows upwelling prone regions.
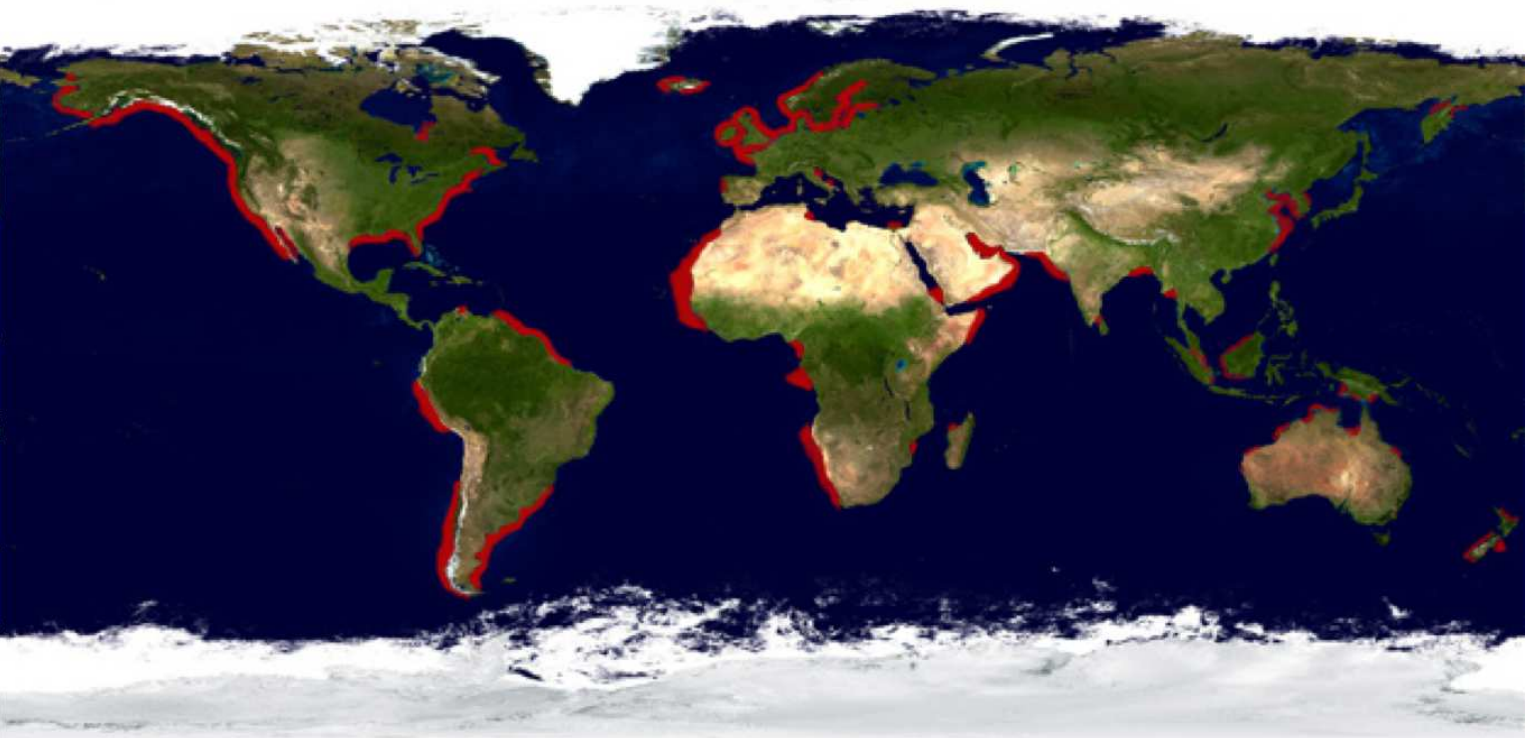
in Baltic sea predominant upwelling regions are the south and east coast of sweden beacause of westerlies, usually downwelling system in west of Baltic Sea
The ocean’s overall role in climate#
The world ocean plays a crucial role in our climate system. It moderates climate in time (diurnally and annually) and redistributes heat spatially in the large-scale ocean circulation. Furthermore its albedo is lower than that of sea ice and it influences the distribution of water vapor which acts as the strongest greenhouse gas.
Atmospheric heat transport is characterized by the Hadley Cell for low latitudes and weather systems and the Ferrell cell for mid latitudes.
Example I
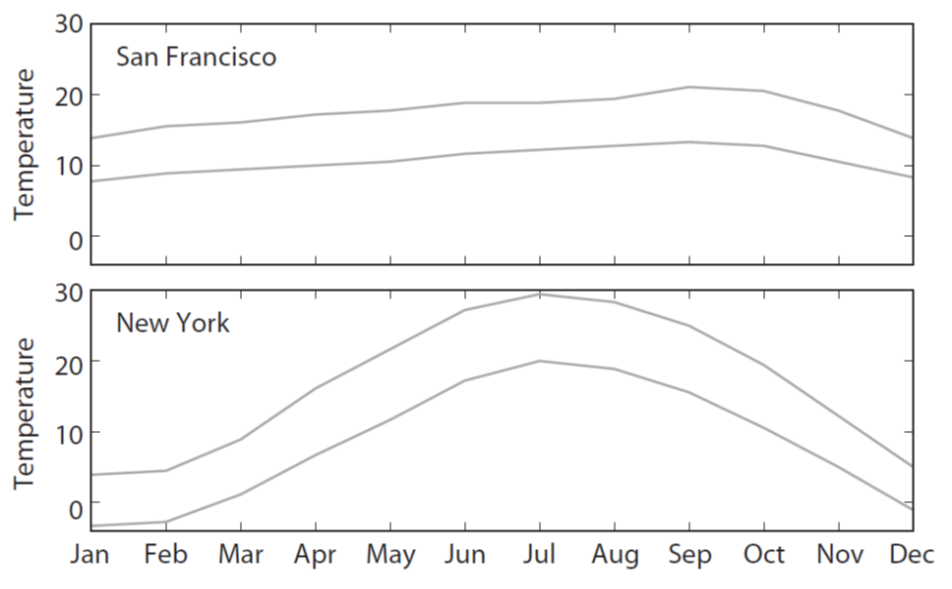
A comparison of the annual temperature profiles of San Francisco (west coast) and New York (east coast) showcases the ocean’s strong influence on local climate, see Fig. 17. Both cities are located at latitudes around 40°N where strong easterly winds dominate the atmospheric circulation. These winds expose New York to the continental climate of Central Northern America resulting in a strong seasonal temperature cycle. On the other side of the continent San Franciscos climate follows the eastward transported oceanic climate. Because of the high heat capacity of water, temperature changes are way smaller which flattens San Franciscos seasonal temperature cycle significantly.
Example II
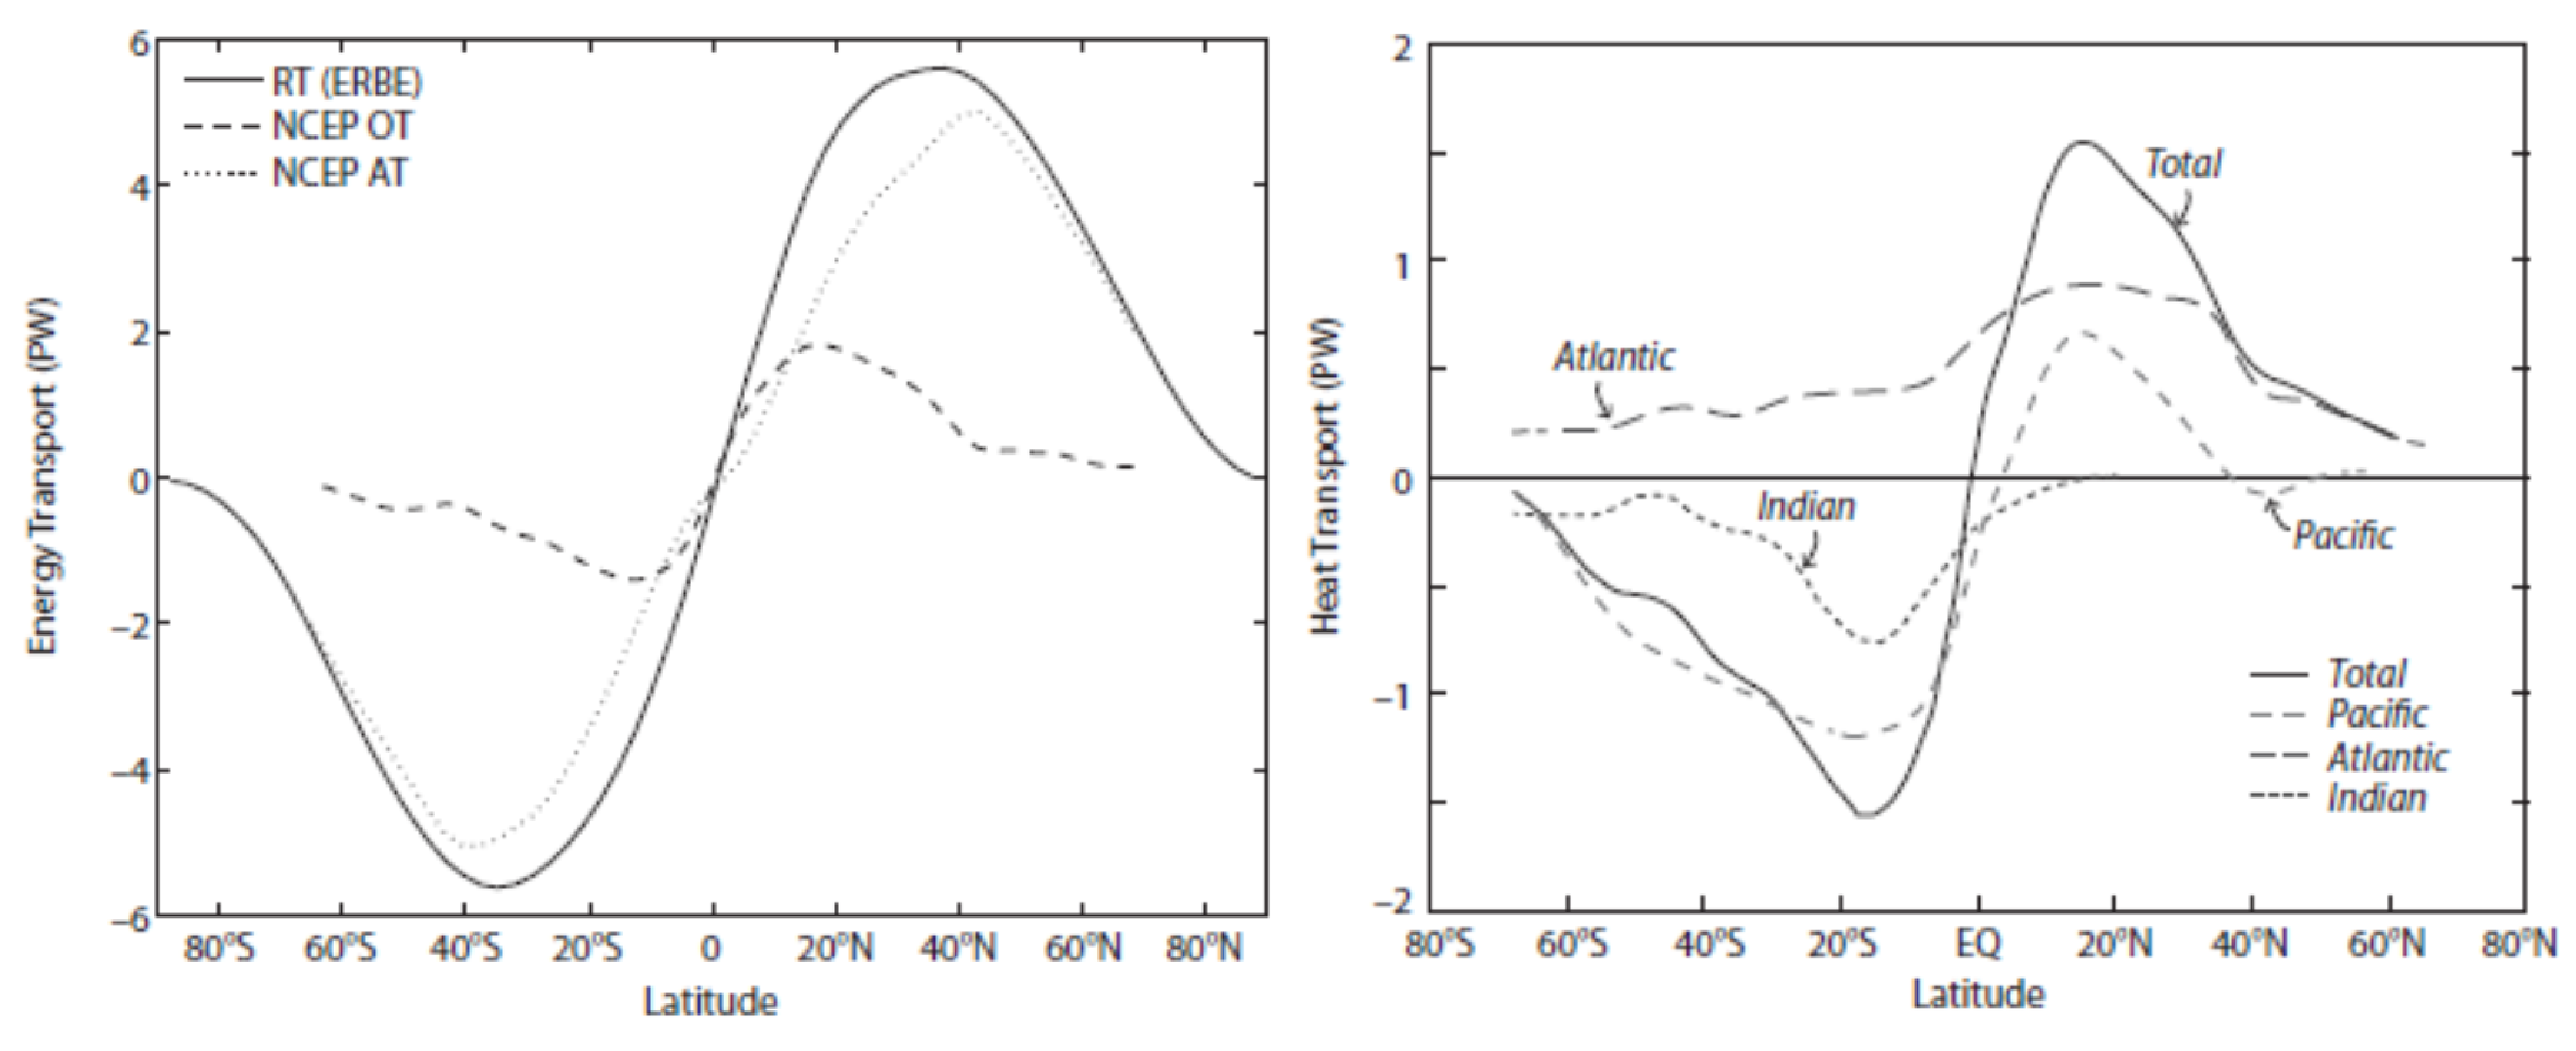
As previously discussed, the global conveyor belt (Fig. 10) transports warm and cold water masses along the world ocean. One way of quantifying the circulation is to look at the meridional heat transport as shown in Fig. 17 and 18. Note that northward transport is characterized with a positive sign. Whilte the atmosphere generally transports more energy, the oceanic transport is actually stronger for latitudes up to 10°S and °N. The heat is transported poleward on both Hemispheres with a maximum between 30-40°S and °N respectively. Fig. 18, right decomposes the total oceanic heat transport into the transports along the three main oceanic basins of the Atlantic, Pacific and Indian Ocean. Note the different signs of the heat transport in the Southern Hemisphere.
Example III:
Not only does the ocean redistribute energy through the climate system, it also emits and absorbs radiation resulting in heat flux into or out of the climate system, as shown in Fig. 20. While most of the ocean absorbs heat in form of solar radiation, some coastal currents actually emit a large amount of heat radiation.
Table of figures#
Figure 1: Copyright M. Pidwirny, 2006. www.physicalgeography.net
Figure 2: Courtesy: E. Kjellström
Figure 3: Figure 3.62 in the lecture notes of Dietmar Dommenget: An Introduction to Climate Dynamics, https://users.monash.edu.au/~dietmard/teaching/dommenget.climate.dynamics.lecture.notes.pdf
Figure 4: Copyright UCAR Center for Science Education. https://scied.ucar.edu/learning-zone/how-weather-works/global-air-atmospheric-circulation
Figure 5: Copyright S. Leyva. https://geophile.net/Lessons/atmosphere/atm_circulation_04.html
Figure 6: Copyright R. Lindsey and L. Dahlmann, 2009, Climate Variability: North Atlantic Oscillation. https://www.climate.gov/news-features/understanding-climate/climate-variability-north-atlantic-oscillation
Figure 7: Figure 3.45 in the lecture notes of Dietmar Dommenget: An Introduction to Climate Dynamics, https://users.monash.edu.au/~dietmard/teaching/dommenget.climate.dynamics.lecture.notes.pdf
Figure 8: Figure 3.48 in the lecture notes of Dietmar Dommenget: An Introduction to Climate Dynamics, https://users.monash.edu.au/~dietmard/teaching/dommenget.climate.dynamics.lecture.notes.pdf
Figure 9: https://www.coastalwiki.org/wiki/File:Ocean-Currents_gkplanet.jpg, access on 29.02.2024
Figure 10: Left: Copyright: National Geographic Society, 2023. https://education.nationalgeographic.org/resource/global-conveyor-belt/, Right: Copyright: Seaice portal, https://www.meereisportal.de/en/learn-more/sea-ice-physics/sea-ice-and-ocean, access on 01.03.2024
Figure 11: Copyright: K. Zalzal, 2018, https://www.earthmagazine.org/article/disrupting-deep-ocean-warming-reaches-abyss/
Figure 12: https://www.hamburger-bildungsserver.de
Figure 13: Copyright: K. Zalzal, 2018, https://www.earthmagazine.org/article/disrupting-deep-ocean-warming-reaches-abyss/
Figure 14: S. Rahmstorf. Thermohaline Circulation. Reference Module in Earth Systems and Environmental Sciences, Elsevier, 2015. https://doi.org/10.1016/B978-0-12-409548-9.09514-2
Figure 15: Figure 3.52 in the lecture notes of Dietmar Dommenget: An Introduction to Climate Dynamics, https://users.monash.edu.au/~dietmard/teaching/dommenget.climate.dynamics.lecture.notes.pdf
Figure 16: Figure 3.55 in the lecture notes of Dietmar Dommenget: An Introduction to Climate Dynamics, https://users.monash.edu.au/~dietmard/teaching/dommenget.climate.dynamics.lecture.notes.pdf
Figure 18: Figure 4 in Yang, Haijun & Li, Qing & Wang, Kun & Sun, Yu & Sun, Daoxun. (2015). Decomposing the meridional heat transport in the climate system. Climate Dynamics. 44. 2751-2768. https://doi.org/10.1007/s00382-014-2380-5.
Figure 19: Figure 5.3 in Trenberth, Kevin E. & Stepaniak David P.. (2004). The flow of energy through the Earth’s climate system. Quarterly Journal of the Royal Meteorological Society. Vol. 130, Issue 603. 2677-2701.
https://doi.org/10.1256/qj.04.83
Figure 20: Figure 6.118 in the lecture notes of Dietmar Dommenget: An Introduction to Climate Dynamics, https://users.monash.edu.au/~dietmard/teaching/dommenget.climate.dynamics.lecture.notes.pdf

